 contextlake
Visualizing the graph
Draw bounded, offline graph slices (`contextlake kb graph`) in any of 11 formats, HTML, DOT, JSON, GraphML, Cypher and six Mermaid diagram types, plus the composed namespace C4 diagram.

contextlake kb graph draws a bounded slice of the graph. The whole thing (hundreds of thousands of
nodes) is too large to render, so every view is scoped from a seed and capped:
contextlake kb graph --overview --open                 # repos-as-nodes: the architecture map
contextlake kb graph --name ForecastService --kind class  # a symbol's neighbourhood (default 2 hops)
contextlake kb graph --node <id> --hops 3              # expand around an exact node id
contextlake kb graph --search "sensor" --open          # seed from a full-text search
contextlake kb graph --repo acme/forecast-api          # one repo's internal code graph
flowchart LR
  A(["contextlake kb graph"]) --> S1["--node / --name / --search
walks outward: --hops,
--relation, --direction"]
  A --> S2["--repo, one repo,
no outward walk"]
  A --> S3["--overview, the fleet,
--max-nodes alone"]
  S1 --> B["every view is capped, and
whatever is dropped is logged"]
  S2 --> B
  S3 --> B
  B --> F["--format"]
  F --> H(["html, the self-contained
offline page"])
  F --> M(["six Mermaid formats,
for a PR or a design doc"])
  F --> X(["dot, graphml, cypher, json,
for Graphviz, Gephi, Neo4j"])
Which seed you pick decides which flags apply at all: only a seeded view walks outward, so --hops,
--relation and --direction have nothing to do on --repo or --overview. sequencediagram
applies that rule in the other direction: it needs exactly one seed, so it is the one format --repo
and --overview cannot produce.
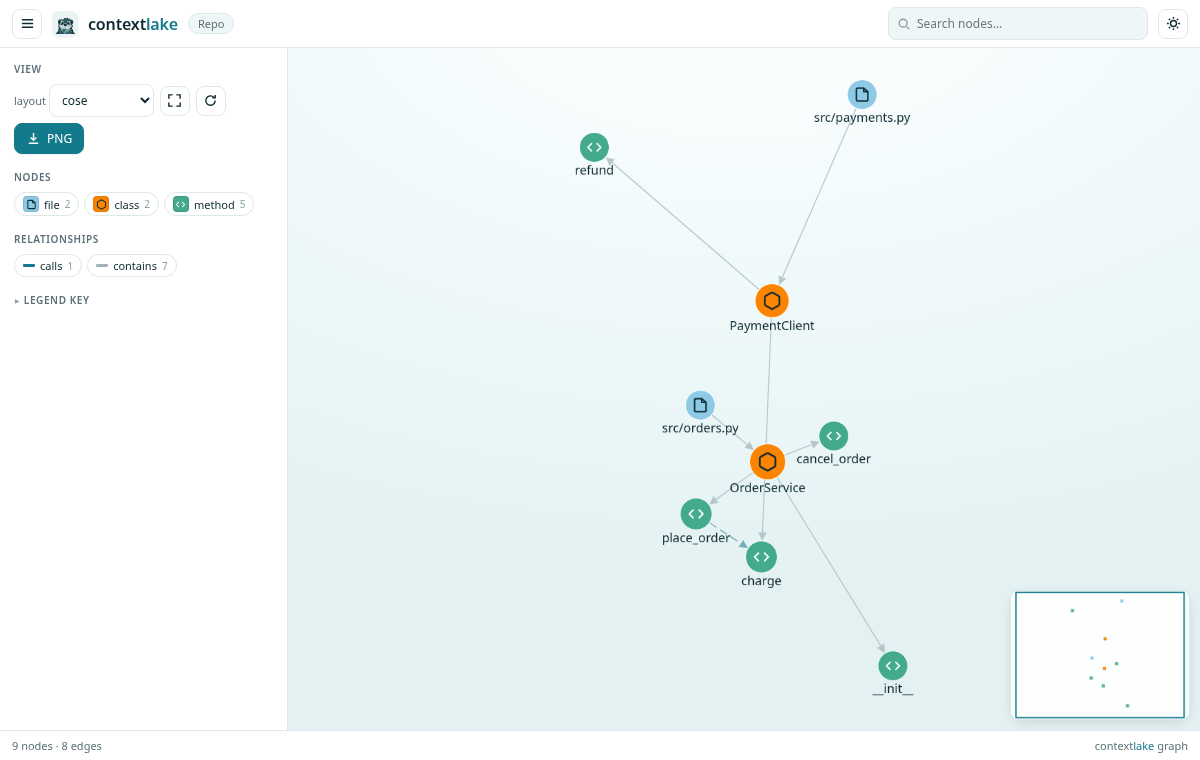
contextlake kb graph --repo <repo> renders one repo's internal code graph to a single self-contained HTML
page: nodes coloured by kind and sized by degree, edges by relation, with an in-page layout switcher,
search, and a minimap; it opens straight from file://:
Pick a seed with one of --node, --name (plus --kind), --search, --repo or
--overview.
--limit (default 20) caps how many seed nodes a --name or --search match contributes,
before the walk starts. The run logs how many matched when it trims. Use it when a name matches
300 symbols and you want a view of the first few.
Then bound the result with three flags.
--max-nodes (default 500, or 5000 on --overview)
--overviewis a fleet inventory, so it loads every repo by default and any of them is findable.- This bounds the whole file. One-hop external nodes count against it too, and links take a bounded share of whatever the repo's own nodes leave unused.
--max-edges (--repo views only)
- No cap by default, which is what the
htmlanddotrenderers want. - 400 for the Mermaid formats:
mermaid,classdiagram,statediagram,erdiagram,deploymentdiagram. A dense repo can pack well over 500 edges into 500 nodes, which used to exceed Mermaid's own render limit and fail outright. Capping edges means a--repoview always renders. It may be truncated, but it never errors. - A seeded Mermaid view gets no edge cap, so it can still exceed that limit and fail. Narrow
it with
--hopsor--max-nodesinstead.
--max-fanout (per-node cap, stops hub nodes exploding)
- 50 on a seeded view.
- Uncapped on a
--repoview unless you pass it, because capping containment fan-out by default would hide a file's own symbols.
Whatever gets dropped is logged. Nothing is silently truncated.
--hops (default 2), --relation and --direction {in,out,both} shape the walk, so they apply
to the seeded modes (--node / --name / --search) only. --overview and --repo do not walk
outward from a seed, so passing those three with either of them has no effect. What each mode does
take: a seeded view, all of them except --max-edges, which the seeded path never receives, so it is
accepted and then ignored; --repo, --max-nodes / --max-edges / --max-fanout;
--overview, --max-nodes alone.
When a --repo view goes over --max-nodes, nodes are kept by degree: the
highest-connected first, ties broken by node id. So a truncated diagram keeps the most connected
part of the repo, not whatever sorted first.
Degree alone is not the whole rule. Every kind present in the view gets a small floor of slots
first. Pure degree ranking starved the rare kinds: on one measured repo it kept 0 of
412 table nodes and 0 of 402 resource nodes, which made erdiagram and deploymentdiagram
render empty for a repo that plainly had the data.
On the dashboard, a repo too large for one diagram is narrowed to its largest module automatically. That works recursively, to any depth, with a clickable breadcrumb back out and a "Narrow further..." picker, instead of an arbitrary slice. See Using the dashboard.
Output formats#
Output is chosen with --format:
html(default), a single self-contained, offline page (cytoscape.js is inlined, so it opens fromfile://with no network, handy air-gapped / behind a proxy).--openlaunches the browser;--cdnproduces a small online-only file instead, and applies to--siteas well as the single-file export.- Nodes are coloured by kind and sized by degree. Edges are styled by relation/confidence, with their labels hidden until you click a node (so the view stays readable).
- Pan, zoom, drag, and a layout switcher (
cose,concentric,breadthfirst,circle,grid,dagre) in the page. Set the initial one with--layout. dagreis a preview: it is layered and directed rather than organic, and below 400 nodes it renders each node as an HTML card instead of a dot.
dot, Graphviz (contextlake kb graph ... --format dot | dot -Tsvg > g.svg).mermaid, the relation graph, pastes into Markdown / GitHub.classdiagram, a Mermaid UML class diagram for a repo (or a seeded slice): classes / interfaces / structs with their methods as members, andinheritsedges as inheritance arrows (<|--extends,<|..implements). Great for a PR or design doc:contextlake kb graph --repo demo/app --format classdiagram.sequencediagram, a Mermaid call-order trace from one seeded function, each caller's callees ordered by call-site line, the order they appear in the source:contextlake kb graph --name verify_station --format sequencediagram. Needs exactly one seed (--node/--name/--search, not--repo/--overview; there's no single obvious ordering across unrelated seeds), and depth follows the view's own--hops. Recursion/cycles stop cleanly (a function already on the current call path isn't re-entered) instead of hanging.statediagram, a Mermaid entity state machine: guarded assignments to a status/state/stage field (if reading.status == Received: reading.status = Validated) become transitions, labeled with the method that makes them. Best with--repo, likeclassdiagram:contextlake kb graph --repo demo/app --format statediagram.- Only guarded transitions are emitted. The source state must be established by a preceding comparison on the same field, so a diagram never claims a transition the code doesn't establish (an honest undercount, not a guess).
- A
--name/--nodeseed can reach the state nodes (via the file that declares them) but not their transitions past the view's--hops. Use--repofor the full picture. - Multiple entities in view each get their own composite block; a single-entity view renders flat.
erdiagram, a Mermaid ER diagram oftable/viewdefinitions and their foreign-keyreferencesedges, from the SQL DDL extractor (see Index & Code Graph):contextlake kb graph --repo demo/app --format erdiagram.- No attribute/column data (the extractor only captures
CREATE TABLE/VIEWnames and FK targets), so entities render as bare boxes with relationship lines, not column lists. - A
REFERENCESclause always points child-row to parent-row, so the parent is drawn on the "one" side of the notation. - Only sees raw
.sqlDDL. An ORM-defined schema (SQLAlchemy, Entity Framework, TypeORM model classes, no literalCREATE TABLEtext anywhere) renders an empty diagram with guidance, not a bug.
- No attribute/column data (the extractor only captures
deploymentdiagram, a Mermaid flowchart of Terraform/HCLresource/data/moduledefinitions grouped by an inferred category, from the HCL extractor (see Index & Code Graph):contextlake kb graph --repo demo/app --format deploymentdiagram.- The categories are network/compute/storage/database/security/other/module. Category is a
keyword heuristic over the resource type prefix (for example
aws_security_group.web-> security). A resource type matching none of the keyword lists lands inotherand gets its own subgraph. depends_onedges reconstructed fromvar./module./type-name interpolation references draw the connections between resources. A single-category view renders flat (no subgraph wrapper).- Terraform-only (HCL is the only IaC language the extractor parses): a repo with no
.tffiles renders an empty diagram with guidance, not a bug.
- The categories are network/compute/storage/database/security/other/module. Category is a
keyword heuristic over the resource type prefix (for example
graphml, the standard GraphML interchange format for Gephi/yEd:contextlake kb graph --repo demo/app --format graphml --output g.graphml. Nodes/edges carry real attributes (kind, name, repo, file, line, lang / relation, confidence, weight) as GraphML<data>keys, so Gephi's own filter and color-by-attribute tools work directly against them, not just a bare shape.cypher,CREATEstatements for a Neo4j/FalkorDB import:contextlake kb graph --repo demo/app --format cypher --output g.cypher, thencypher-shell -f g.cypher(or FalkorDB's own loader). Node labels come fromkind, relationship types fromrelation, both backtick-quoted (contextlake's kind/relation vocabularies are open text, not a fixed enum, so quoting handles arbitrary values without a lossy sanitization pass into PascalCase/UPPER_SNAKE).json, the raw{nodes, edges, meta}for cytoscape / custom tooling (Gephi/yEd users want--format graphmlinstead, real typed attributes, not a bespoke shape to parse).
To explore a large graph interactively, run contextlake kb graph --overview --serve. It starts
a local web UI. Clicking a node expands it, fetching its neighbours on demand, so you can
walk the graph without rendering all of it first.
With --overview it serves the whole cross-linked site: an overview plus a page per repo, each
rendered on demand rather than pre-built. That is the live counterpart of --site.
It binds --host (default 127.0.0.1) and --port (default 8765), so with no flags it is at
http://127.0.0.1:8765.
Like the dashboard, it answers a request only when the Host header names the address it was
bound to, or localhost, port included. That pinning stops a page on an attacker's domain from
re-resolving to 127.0.0.1 and reading your graph cross-origin. Bind the address you intend to
browse rather than a wildcard. See
Mutating routes.
Working the served graph#
The page --serve gives you is a surface you drive, not a picture you look at. Four controls
carry most of the work.
Expand a node, as far as you want#
Click a node and contextlake fetches its neighbours from the store and adds them to the canvas. Two controls in the sidebar decide what that fetch asks for:
- depth: how many hops out to walk, 1 to 3. The server caps it at 3, so a slider at its maximum and the server's ceiling are the same number.
- edges:
both,outgoing, orincoming. This chooses which edges the walk is allowed to follow, so it changes which nodes come back, not how they're drawn.
Both apply to the next node you expand. Expanding is additive, so nothing you've already opened is removed when you change them.
Set edges to outgoing and you're asking "what does this depend on"; set it to incoming and
you're asking "what depends on this".
Trace what a node reaches#
Selecting a node highlights the things next to it. To follow the chain instead, use Trace downstream in the inspector. It walks edge direction as far as it goes and reports how many nodes it found ("4 nodes downstream"). It appears only on nodes that have an outgoing edge.
It traces the graph currently on the canvas. In --serve mode that's whatever you've expanded so
far, so if a trace looks short, expand further with depth raised, then run it again.
Read the prose about a node#
Read the wiki in the inspector opens the generated wiki for the node's repository. It appears only when that repository has one.
Where it lands depends on how you opened the graph:
- In the dashboard, it opens the subsystem page covering that node's file, and falls back to the repository's own page when no subsystem page covers it.
- On a
--siteexport, it opens the repository page beside it. The export writes whole-repo pages only, so there is nothing narrower to open.
There is no link to a heading. Generated pages are written in page-level sections (Overview, Setup & Run, Architecture, Dependencies, Gotchas) and the model is asked to leave out any it has nothing to say for, so no section is about one symbol and no named section is certain to be there. A link to a heading that was not written lands at the top of the page and looks like it worked.
Filter with the legend#
The Nodes legend groups every kind present into the vocabulary's ten bands: Symbols, Containers, Service surfaces, Data model, Infrastructure, Presentation, Configuration, Documents, Cross-source, Boundary. A band appears only when something in it is on the canvas.
Click any kind to hide it, and any relationship in the Relationships legend to hide those edges. Reset view & filters in the toolbar brings everything back.
What's folded away, and where it went#
On --site pages, structural leaves are folded into their container rather than drawn. A node
folds when nothing points out of it and the only thing pointing at it is contains: a config
key, a macro, a struct field. On a large repository these are most of the graph, and drawing
them adds a dot and a label that answer nothing the container doesn't already answer.
Nothing disappears quietly. The status bar says how many went
(412 leaves folded into their containers), and selecting a container shows the tally for that
node, as folded 19 (config_key 14, macro 5). The full graph is still in the store:
contextlake kb query <text> --kind config_key lists them, contextlake kb graph --search <text>
--kind config_key draws them, and the MCP tools reach them too.
Composed namespace C4 diagram#
contextlake kb graph --c4 renders a composed C4 Context and Container diagram over the whole
fleet:
- namespaces are the boundaries
- repos are the containers inside them
- aggregated
depends_on, HTTPflowand eventflowedges become the labelled connections between services, grouped by flavour and weight, for examplehttp x3
It draws graph data that index and connect already extracted, so it runs fully offline and
adds no new extraction pass.
Two flags shape it:
--group-depth N(default1) sets how deep into the namespace path the boundaries are drawn.--repos <glob>scopes the diagram to matching repos.
It only draws coupling the graph already resolved, ranked by weight, so it invents no links. Folding event flow in beside HTTP stops it telling an HTTP-only half story:
contextlake kb graph --c4 --group-depth 2 --open       # HTML, open in the browser
contextlake kb graph --c4 --format dot > c4.dot        # clustered DOT, copy-pasteable
With --c4, three formats work:
html(default), an interactive page with namespace boundaries as compound nodes, written to<store>/graphs/c4.htmldot, Graphviz clustered DOT withsubgraph cluster_*boundariesjson, the raw payload
Not supported with --c4: mermaid, classdiagram, sequencediagram, statediagram,
erdiagram and deploymentdiagram. The command exits with an error. --serve does not apply
either, since the C4 view is a generated file, not a live server.
One rough edge. --format graphml and --format cypher are neither rejected nor honoured.
--c4 falls through to the HTML renderer, and because the output path is only defaulted for
--format html, it prints that HTML to stdout. If you hit this, pass --output <path>, and use
dot or json for a real C4 export.
C1: external systems#
--c4 --c1 adds a layer on top of the same view: one dashed box per distinct host an indexed repo
calls over HTTP that never resolves to any indexed repo's exposed route, connected by a
calls_external x<weight> edge, drawn outside every namespace boundary:
contextlake kb graph --c4 --c1 --group-depth 2 --open
Deliberately unclassified. contextlake can't tell a genuine third-party dependency (Stripe,
GitHub's API) apart from an internal service this fleet hasn't indexed yet, both look
identical here: an HTTP call whose target path matches no indexed repo's exposes route. Read the
box labels yourself; you'll recognize your own internal hosts. --c1 requires --c4 (it has no
meaning on its own) and needs no new extraction pass, the host was already captured at index time,
just never used until this view asks for it.
The graph, on this page#
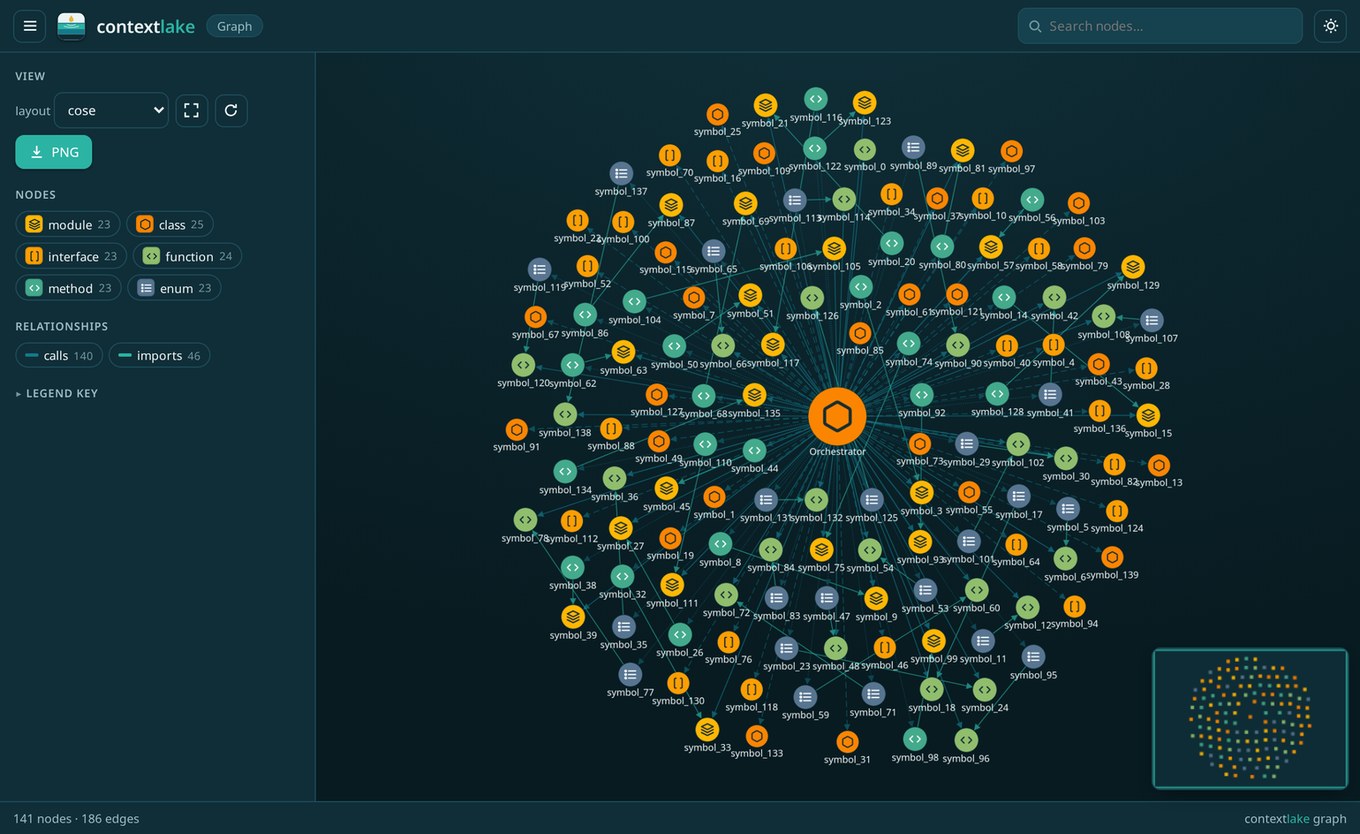
The real visualizer, on contextlake's own code. Drag, zoom, search, and open a node to see its file and line. It is the shipped visualizer, not a recording, and it runs offline with no network calls.