 contextlake
Visualize the graph
Draw bounded, offline graph slices (`contextlake graph`) in HTML, DOT, Mermaid, or a class diagram, plus the composed namespace C4 diagram.

contextlake graph draws a bounded slice of the graph. The whole thing (hundreds of thousands of
nodes) is far too large to render, so every view is scoped from a seed and capped:
contextlake graph --overview --open                 # repos-as-nodes: the architecture map
contextlake graph --name OrderService --kind class  # a symbol's neighbourhood (default 2 hops)
contextlake graph --node <id> --hops 3              # expand around an exact node id
contextlake graph --search "payment" --open         # seed from a full-text search
contextlake graph --repo acme/orders-api           # one repo's internal code graph
contextlake graph --repo <repo> renders one repo's internal code graph to a single self-contained HTML
page: nodes coloured by kind and sized by degree, edges by relation, with an in-page layout switcher,
search, and a minimap; it opens straight from file://:
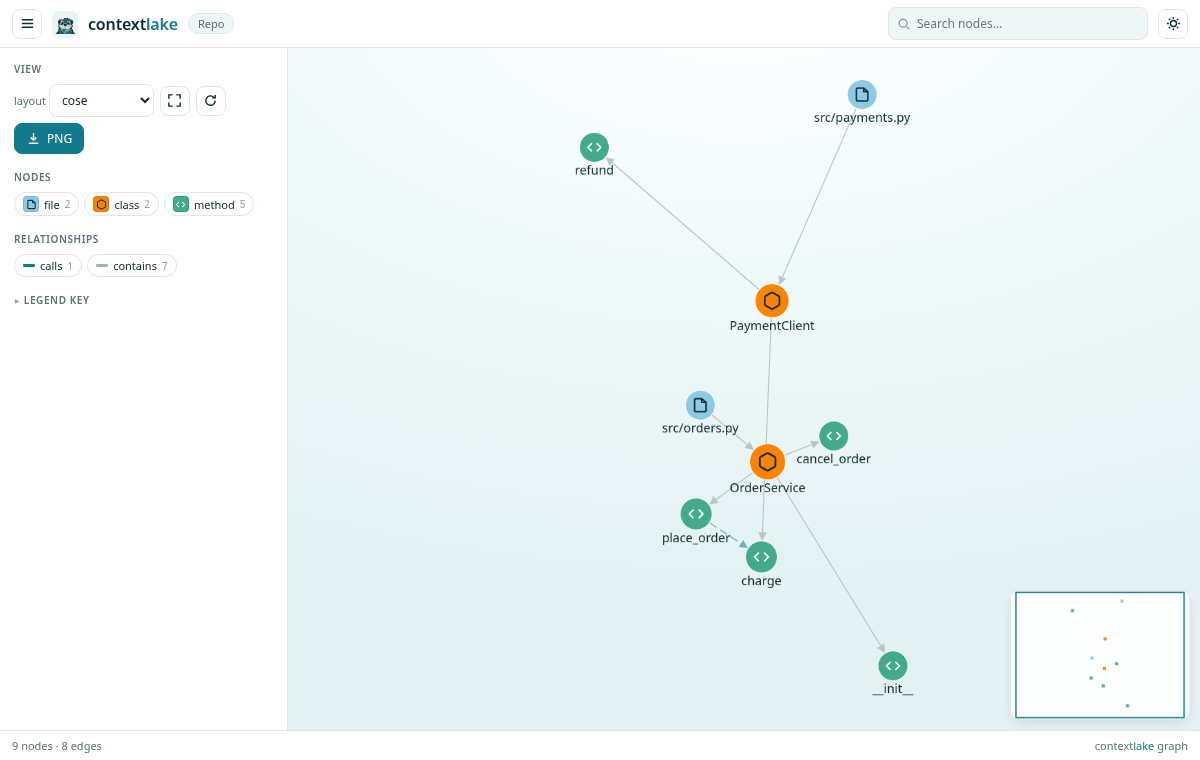
Seed with one of --node / --name (+--kind) / --search / --repo / --overview. Bound the result
with --hops (default 2), --max-nodes (500), --max-fanout (50, a per-node cap that stops hub nodes
from exploding), --relation, and --direction {in,out,both}, whatever is dropped is logged, never
silently truncated.
Output formats#
Output is chosen with --format:
html(default), a single self-contained, offline page (cytoscape.js is inlined, so it opens fromfile://with no network, handy air-gapped / behind a proxy). Nodes are coloured by kind and sized by degree; edges are styled by relation/confidence with their labels hidden until you click a node (so the view stays readable). Pan, zoom, drag, and a layout switcher (cose,concentric,breadthfirst,circle,grid) in the page, set the initial one with--layout.--openlaunches the browser;--cdnproduces a small online-only file instead.dot, Graphviz (contextlake graph ... --format dot | dot -Tsvg > g.svg).mermaid, the relation graph, pastes into Markdown / GitHub.classdiagram, a Mermaid UML class diagram for a repo (or a seeded slice): classes / interfaces / structs with their methods as members, andinheritsedges as inheritance arrows (<|--extends,<|..implements). Great for a PR or design doc:contextlake graph --repo acme/app --format classdiagram.json, the raw{nodes, edges, meta}for Gephi / cytoscape / custom tooling.
For interactive exploration of a large graph, contextlake graph --serve runs a local web UI where
clicking a node expands it (fetches its neighbours on demand) so you can walk the graph without
pre-rendering all of it.
Composed namespace C4 diagram#
contextlake graph --c4 renders a different kind of view: a composed C4-Context/Container diagram over
the whole fleet, namespaces are the boundaries, repos are the containers inside them, and the aggregated
depends_on, HTTP flow, and event flow edges become the labeled inter-service connections (grouped by
flavor and weight, e.g. http x3). It renders graph data that index/connect already extracted, so it
runs fully offline and adds no new extraction pass. --group-depth N (default 1) controls how deep into
the namespace path the boundaries are drawn, and --repos <glob> scopes the diagram to matching repos.
Because it only draws coupling the graph already resolved (weight-ranked), it doesn't invent links, and
folding event-flow in alongside HTTP keeps it from telling an HTTP-only half story:
contextlake graph --c4 --group-depth 2 --open       # HTML, open in the browser
contextlake graph --c4 --format dot > c4.dot        # clustered DOT, copy-pasteable
Output is chosen with --format: html (default, an interactive page with namespace boundaries as
compound nodes, written to <store>/graphs/c4.html), dot (Graphviz clustered DOT with subgraph
cluster_* boundaries), or json (the raw payload). --format mermaid and --format classdiagram aren't
supported with --c4 (the command exits with an error), and --serve doesn't apply either, the C4 view
is a generated file, not a live server.